Usage
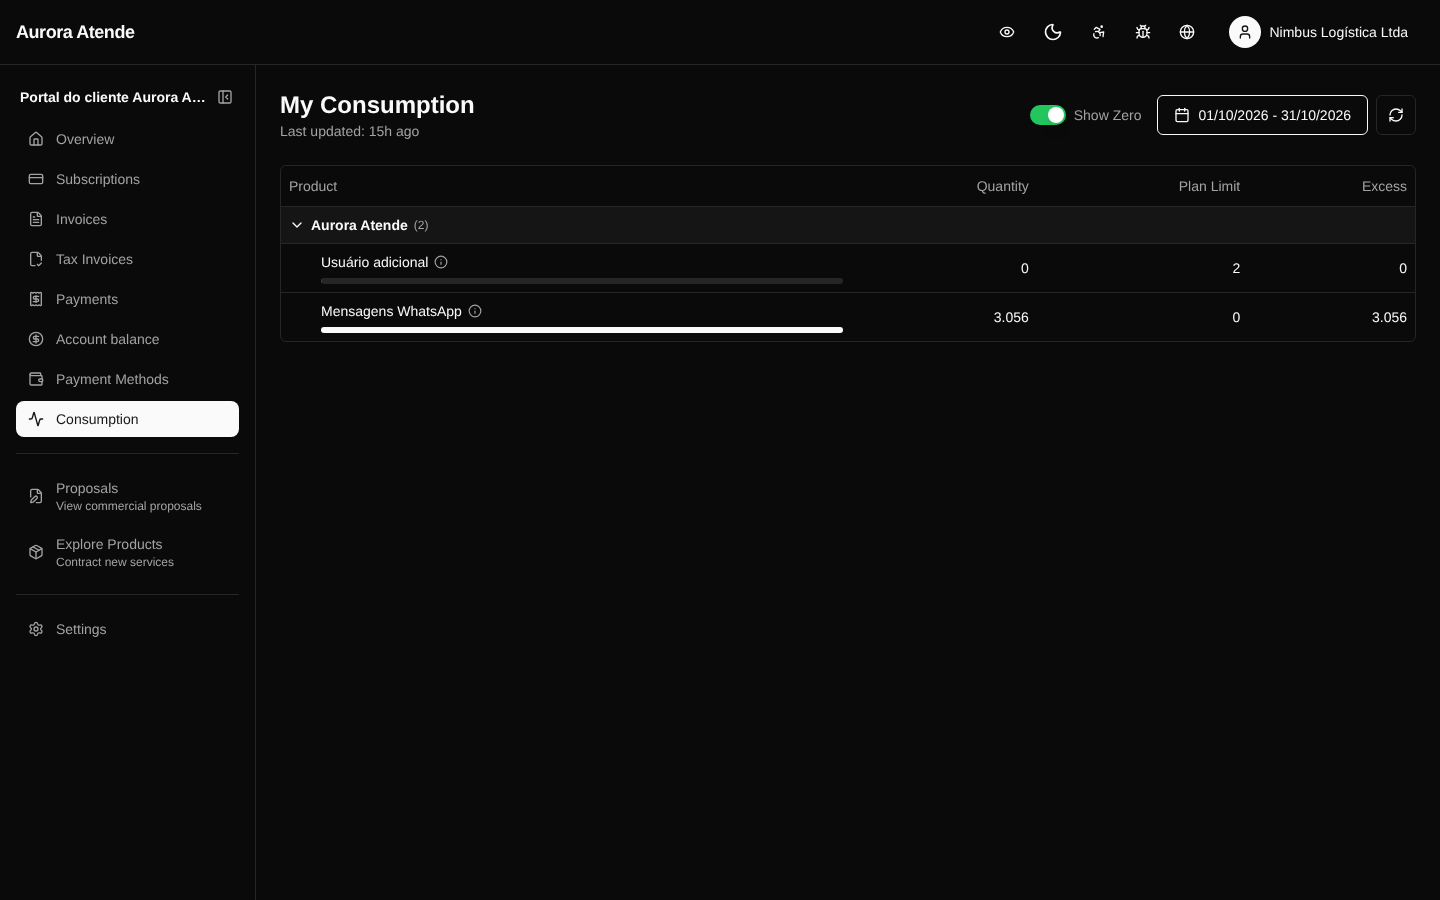
The /portal/usage page shows the customer the metered consumption accumulated in the current cycle — how many API calls, messages sent, events processed or GBs stored, according to the metrics defined by the organization.
What is displayed
- List of active metered products on the account
- Consumption in the period with the correct unit of measure
- Comparison with the previous period (when available)
- Estimated charge for the next invoice, based on consumption so far
- Limits and alerts when the product has a cap or tiers configured
Filters
- Date range — defaults to the start of the current cycle through today
- Product — when there are several metrics
Updates
The data reflects the same backend used by the administrative dashboard. Events arrive via the Usage Records API, integrations or the usage-sync worker (hourly). The delay is typically a few minutes.
What it is for
- Predictability — the customer knows what they will pay before the cycle turns over.
- Anomaly detection — suspicious spikes become evident.
- Support — billing discussions start from the same numbers the dashboard shows.
Screenshot