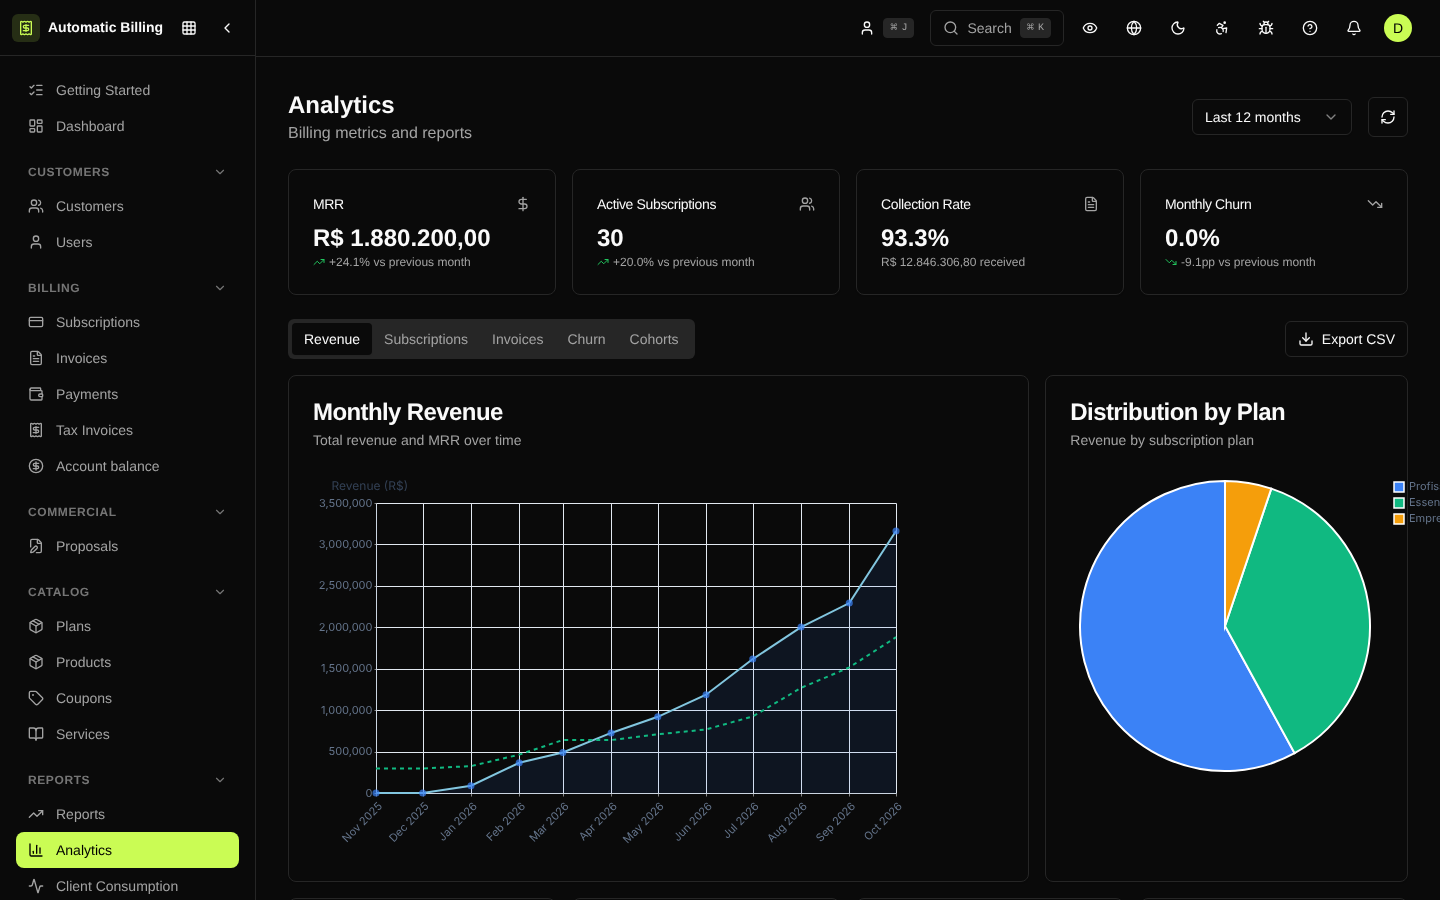
Analytics
The Analytics area (/dashboard/analytics) turns billing operational data into SaaS metrics for the finance and product teams: MRR, ARR, churn, LTV, ARPU, cohort retention and the billing funnel.
Main metrics
- MRR (Monthly Recurring Revenue) — normalized sum of the subscriptions active in the month.
- ARR — annualized projection of MRR.
- MRR Movement — how much of the change came from new, expansion, contraction, reactivation and churn.
- Churn — number and percentage of subscriptions canceled in the period.
- NRR (Net Revenue Retention) — how much the existing base grew or shrank, not counting new customers.
- ARPU (Average Revenue Per User) — average revenue per billing account.
- LTV (Lifetime Value) — estimated revenue per customer over time.
Visualizations
The page uses Vega/Vega-Lite charts to show:
- MRR time series with a monthly movement waterfall.
- Billing funnel — issued → sent → paid → failed.
- Cohort retention — heatmap showing the survival of each customer cohort.
- Distribution by plan — how many subscriptions on each plan and MRR per plan.
Filters
- Date range — defaults to the last 12 months.
- Plan — narrow down to one or more plans.
- Currency — when the organization operates in more than one.
Where the data comes from
Analytics queries the operational tables (subscriptions, subscription_versions, invoices, payments) directly, filtered by organization_id. There is no ETL: the numbers reflect the current state of the database in real time.
Export
Each chart can be exported as CSV or PNG. For raw (row-by-row) extractions, use Reports or Exports.
Screenshot